Filtering Connections
Within the Business Process Visualization page in Process Intelligence, you can apply filters to assist you in finding business connections.
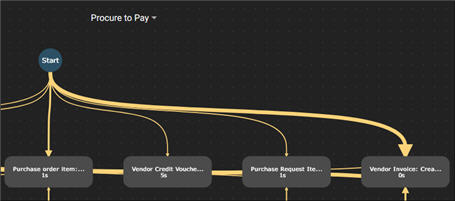
Business Process Visualization Page
The business process may extend off the Business Process Visualization page. To view the business process, you can do one of the following steps:
-
Use the mouse wheel to zoom in and out.
If you zoom out and have trouble reading the activity, click on the activity. A pane opens on the right side with the activity information.
- Click on the business process in the Business Process Visualization page to scroll or drag the process.
- Use the Harmony view. For more information, see Reviewing Activities in the Harmony View.
To filter connections:
-
From the top of the Data Management page, click the Process Analysis
 button.
The Business Process Visualization page opens.
-
In the right pane, select a business process from the Business Process drop-down list.
The process appears in the Visualization page.
-
(Optional) Before you filter your connections, you may want to filter variants and activities. For more information, see Filtering Variants and Filtering Activities.
-
Click the Filters
 tab.
tab. -
In the Filters tab, expand the Connections section.
-
Filter connections with the following tools:
Filter
Description
Frequency
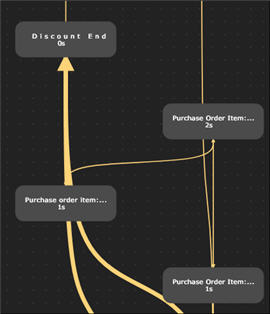
Use the Connection Frequency slider to see the number of times a connection within a variant happens.
The most frequent connections are shown with thicker lines.
Duration
Use the Connection Duration slider to see how long it takes for a specific connection.
Connections that meet the duration criteria are shown with thicker lines.