Viewing User Statistics on the Business Process Visualization Page
On the Business Process Visualization page, you can highlight SAP ST03 user statistics by frequency. User statistics identify which SAP transaction codes are used most frequently in process automation.
Before viewing SAP transaction codes, you must have uploaded an SAP ST03 file into Process Intelligence. For more information, see Uploading User Statistics in Process Intelligence.
To view user statistics:
-
From the top of the Data Management page, click the Process Analysis
 button.
The Business Process Visualization page opens.
-
In the right pane, select a business process from the Business Process drop-down list.
The process appears in the Visualization page.
The Business Process Visualization page opens with the most common variant shown at the highest frequency. If needed, filter variants before you highlight them. For more information, see Filtering Variants.
-
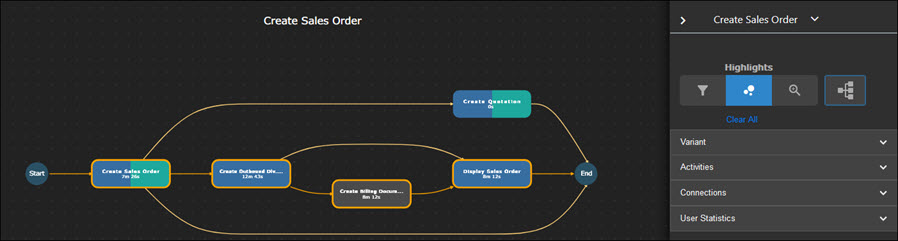
Click the Highlights
 tab.
tab.The Highlights tab opens.
-
In the Highlights tab, expand the User Statistics section.
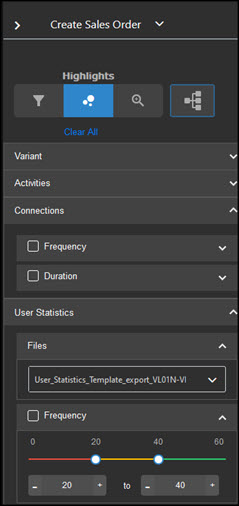
-
In the Files section, select an ST03 user statistics file from the drop-down list.
-
Select the Frequency option.
The User Statistics - Frequency filter appears in the process graphical representation screen.
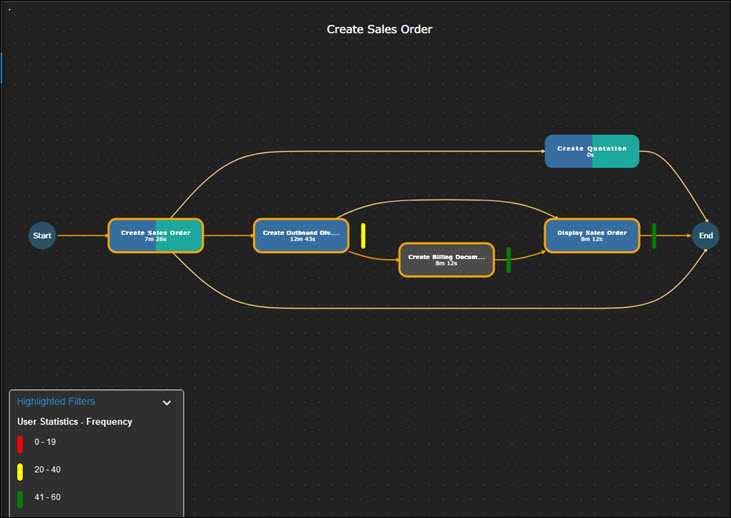
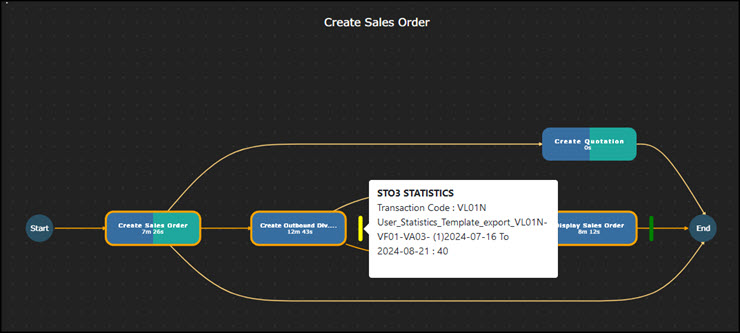
Bars appear in the graph displaying the frequency of a specific transaction code.
-
Hover over a frequency bar to view which transaction code is represented.