Example: Viewing a List of Certify Processes with Certify Results API
This example shows how to use the Certify Results API to get a list of Certify processes specified by the process folder.

Prerequisites
- Generate a token in Certify Results API. For more information, see Generating a Token in Certify Results API.
- If Microsoft® Excel® will be used to access data from Certify Results API, install the Microsoft Power Query plug-in. For more information, see https://support.microsoft.com/en-us/office/introduction-to-microsoft-power-query-for-excel-6e92e2f4-2079-4e1f-bad5-89f6269cd605 and https://www.microsoft.com/en-us/download/details.aspx?id=39379&CorrelationId=0a1fb29a-5281-4097-b3e6-431367168cc1.
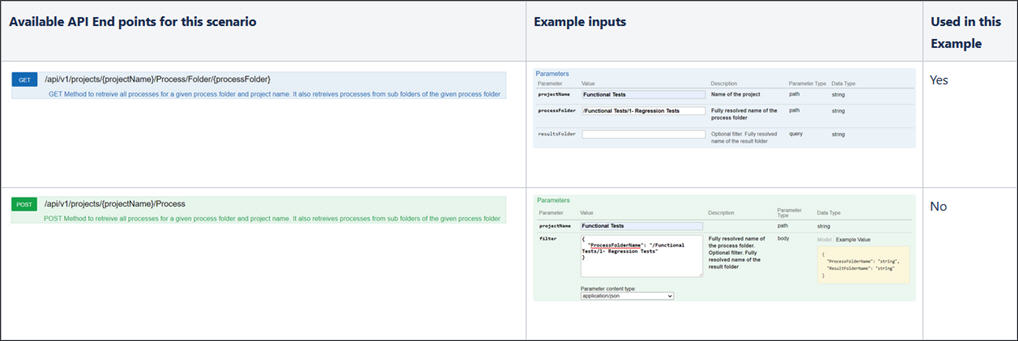
API Endpoints
Microsoft Excel Example
-
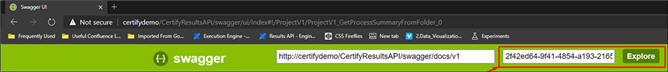
Open the Certify Results API Swagger page:
http(s)://yourdomain/CertifyResultsAPI/swagger/ui/index
-
Generate a token. For more information, see Generating a Token in Certify Results API.
-
Add the API token to Swagger.
-
Enter the required inputs to the GET /api/v1/projects/{projectName}/Process/Folder/{processFolder} endpoint as described in the above API Endpoints section.
-
Click the Try it out! button.
-
Copy the URL that was generated in the Request URL section.
Example:
https://certifydemo/CertifyResultsAPI/api/v1/projects/Functional%20Tests/ResultFolders/%2FFunctional%20Tests%2FExecution%20Manager
-
Open Microsoft Excel.
-
Click the Data tab.
-
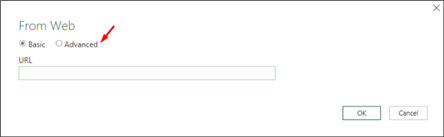
From the Data tab, click the From Web button.
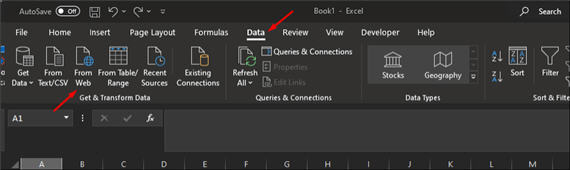
The From Web dialog opens.
-
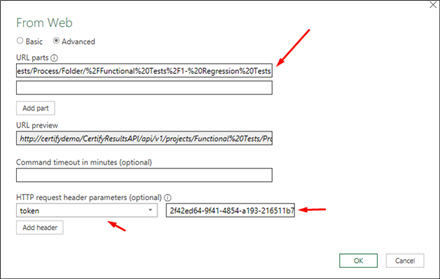
Select the Advanced option.
-
In the URL parts field, paste the resultsAPIResultsFolderUrl value.
-
From the HTTP request header parameters (optional) field, enter token.
-
In the second field, paste the resultsAPIToken value.
-
Click OK.
-
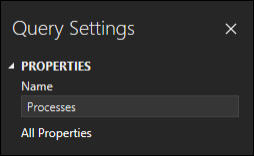
From the Query window in Microsoft Excel, edit the query name to Processes.
-
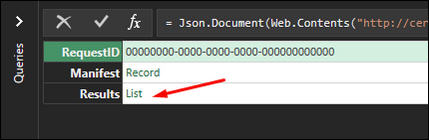
Click on the List link next to Results column.
-
Click the To Table button to expand the data.

The To Table dialog opens.

-
Click OK.
-
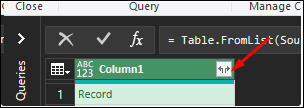
In the Queries window, click the Expand button on the right corner of the first column.
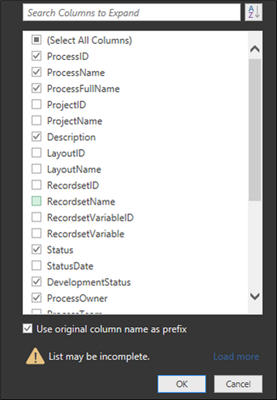
- Select the following columns:
- ProcessID
- ProcessName
- ProcessFullName
- Description
- Status
- DevelopmentStatus
- Process Owner
- Process Folder ID
- Process Folder Name
- CreatedByUser
- ModifiedByUser
- (Optional) Expand the UserName column and select the two following columns:
- CreatedByUser
- ModifiedByUser

-
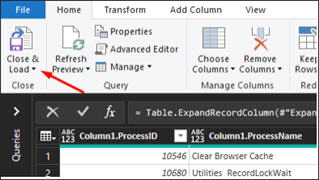
Click the Close & Load button.
A new sheet with the tabular data is populated.
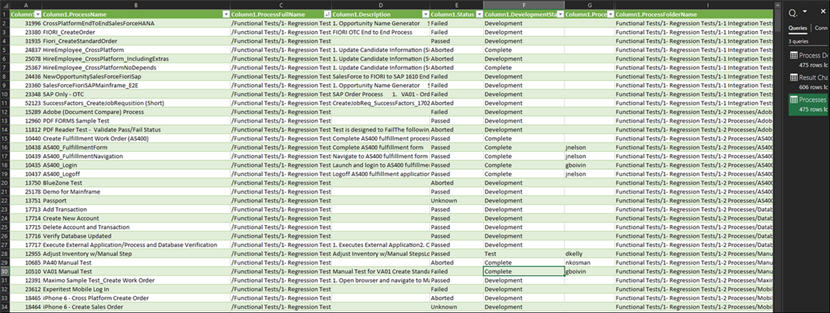
The data can be used to create pivot tables and charts using Excel.
-
Save the file.
-
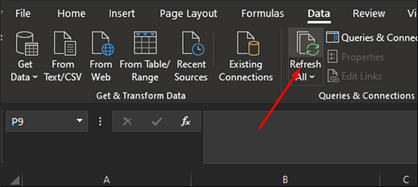
In the Data tab, click the Refresh All button to pull live data.