Getting Started with Worksoft Impact
The Getting Started section provides a high-level description on how to use Worksoft Impact. For detailed procedures on using Impact, see the How To section.
Accessing Worksoft Impact
The URL address for Worksoft Impact is configured during installation:
http://<server>/<virtual folder name>/
The default virtual folder name is Impact.
If you have any questions about your specific URL address, please ask your IT administrator.
Navigating the Worksoft Impact Dashboard
The Worksoft Impact dashboard provides a comprehensive view of your generated analyses, transports, and processes. The dashboard helps you plan and manage your automation test repository to ensure test coverage.
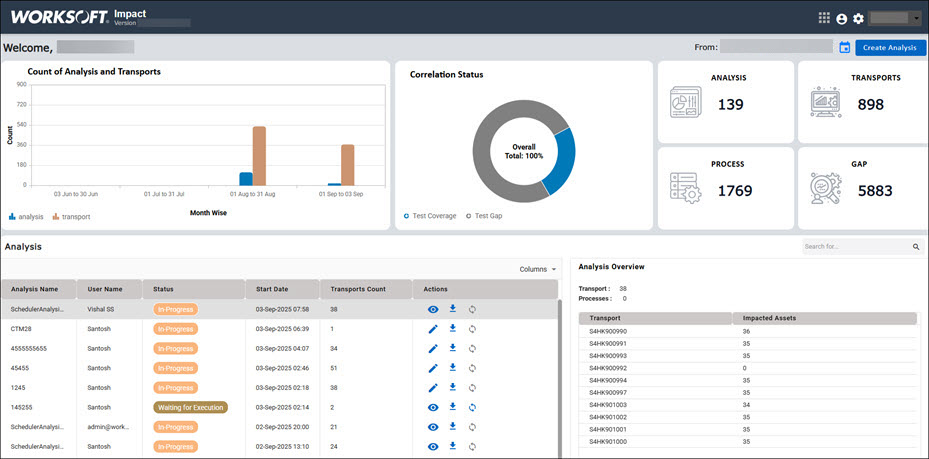
Before you view the information, you can set the date range by clicking the Date Range  button to filter the data on the dashboard. By default, the selected time range is three months.
You can view the following information in the selected date range from the Worksoft Impact dashboard:
|
Section |
Description |
|
Count of Analysis and Transports |
The graph shows the number of analyses and transports created. |
|
Correlation Status |
The Correlation Status graph displays the test coverage and test gap percentages. |
|
Data Cards |
This section displays the total number of analyses, processes, transports, and the number of test coverage gaps. |
|
Analysis Table |
This table lists all of the analyses you created during this time frame. The most recent analysis appears at the top of the table. From this table, you can view the following information about the analysis:
For more comprehensive information, see Understanding the Analysis Table. |
|
Analysis Overview |
When you select an analysis in the Analysis table, the specific transports and the number of impacted assets appear in this section. |
If you are trying to find a specific analysis in the Analysis table, use the Search tool above the Analysis Overview section.
Understanding the Analysis Table
The Analysis Table lists all of your analyses and the following information:
|
Column |
Description |
|
Analysis Name |
Unique name for your analysis |
|
User Name |
Name or email of the user who initiated the analysis |
|
Status |
Current status of the analysis:
|
|
Start Date |
Date and time when the analysis was created |
|
Transport Counts |
Displays how many transports are used in the specific analysis |
|
Actions |
Use the following icons to perform these actions:
|
 View -View the execution status. This button is enabled after the execution process has been completed and the status displays Completed.
  Edit - Edit the analysis while it is running.
 Download -Download the analysis and all its details in an XLSX format.
  Sync - Sync the CTM suite's current status. This button is enabled after the suite has completed its run in CTM whether the suite has passed or failed. You can only view the analysis if the sync is enabled for this status.
 Delete -Delete the analysis.