Configuring the Worksoft Automation Insights Dashboard
The Worksoft Automation Insights Dashboard gives teams ongoing visibility into the health and performance of their Worksoft automation program. You can analyze the Worksoft automation environment and help teams improve their test performance and maintain adherence to best practices.
The Automation Insights Dashboard is customizable, and you can select which metrics you want to view.
To select a metric for the Automation Insights Dashboard:
-
Sign in to the Worksoft Automation Insights.
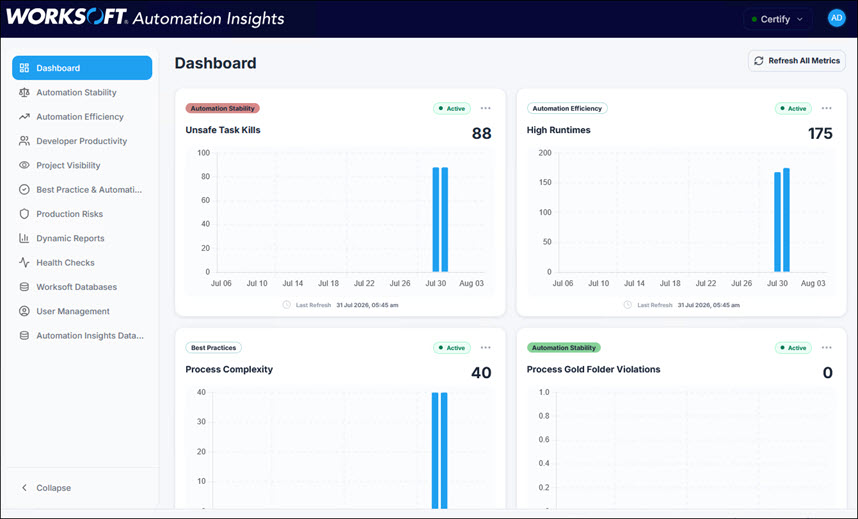
The Automation Insights Dashboard opens.
-
In the Navigation pane, click on the window where the metric you want to add to the Dashboard is located.
-
To add the metric to the Dashboard, click the More Options
 button and select Configuration.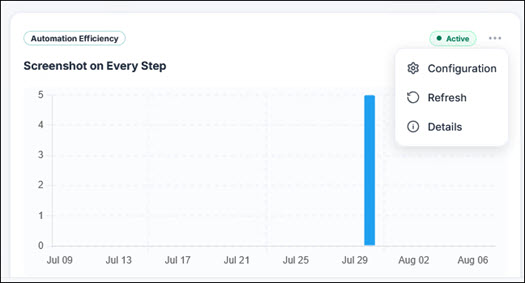
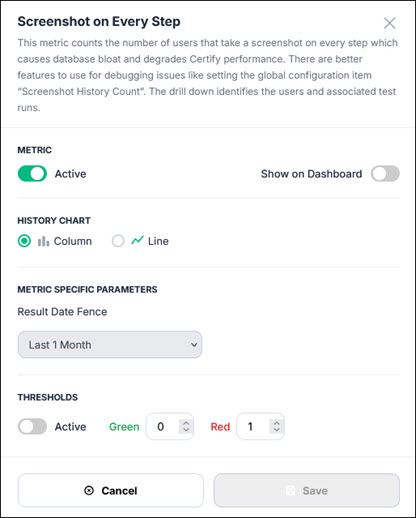
The Metric Configuration dialog opens.
-
Enable the Show on Dashboard option.
-
Click Save.
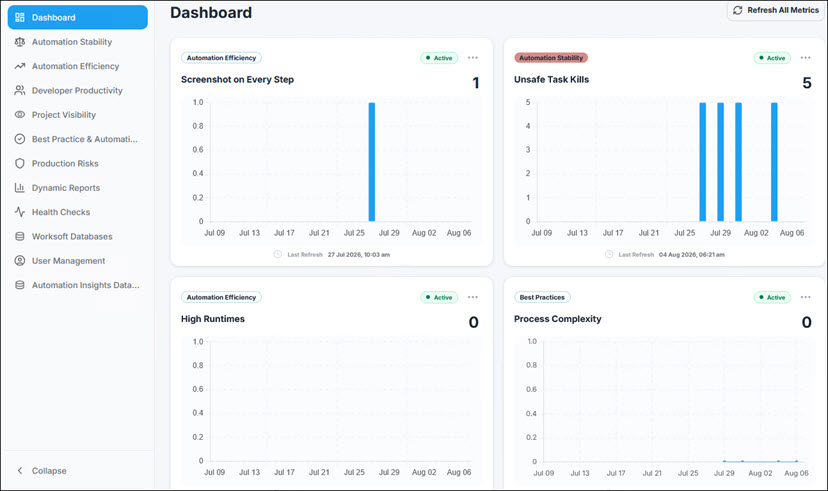
The metric now appears in the Dashboard.
-
Repeat this procedure for other metrics.
To customize the Automation Insights dashboard:
-
Click the User Account
 button on the top right of Automation Insights and select Dashboard Configuration.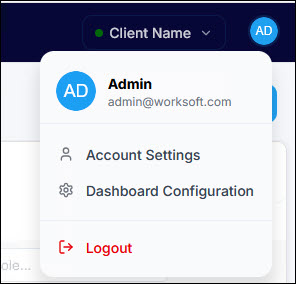
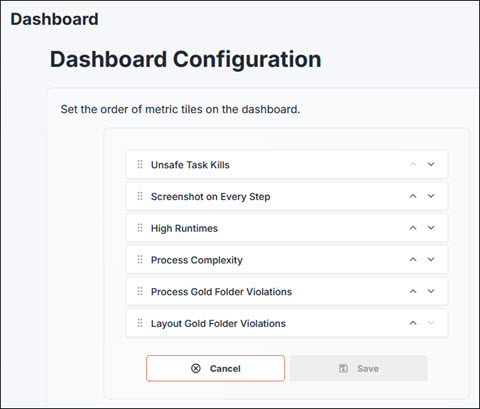
The Dashboard Configuration dialog opens and lists the metrics you selected.
-
Set the order of metrics on your Dashboard by using the Move Up and Move Down
 buttons to rearrange the order.
 -
After you have completed rearranging the Dashboard order, click Save.
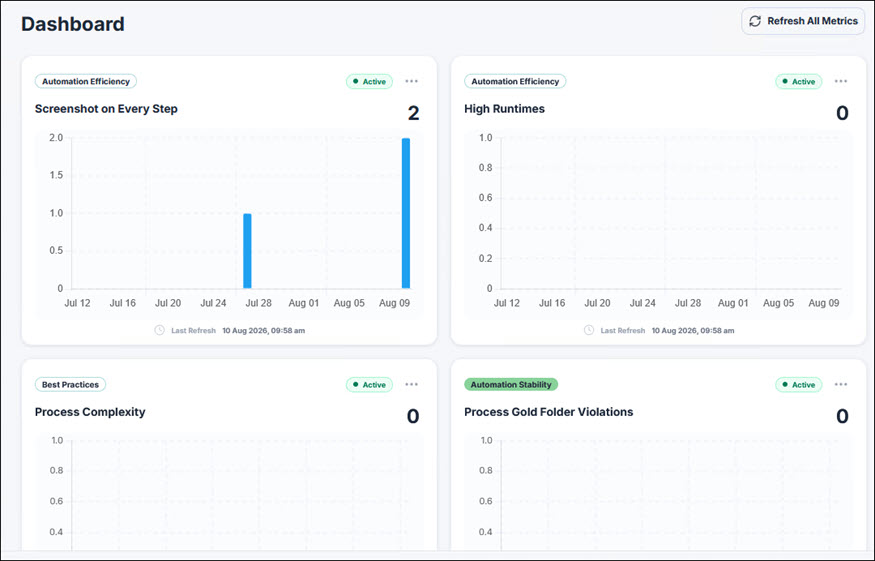
The Dashboard opens with the metrics arranged as you had configured.
 Related Topics